Load Testing
Load testing isn't just about the AI model. It stress-tests the entire stack: network, routing engine, AI agent, CRM integrations, and agent desktop. Latency that looks acceptable at 1 concurrent call often becomes a trust-eroding 3+ second gap at 20.
Drive concurrent calls at your voice agent and measure how latency, success rate, and infrastructure behave under volume. Voice load tests catch failure modes that single-call regression tests cannot: queue saturation, provider rate limits, agent backend timeouts, and degradation patterns that only emerge above N concurrent sessions.
What Load Testing Catches
| Failure mode | Symptom in results |
|---|---|
| Agent backend saturation | avg_turn_taking_latency p90 climbs sharply above baseline |
| Telephony / TTS rate limits | Conversations fail to start; result_completed rate drops |
| Memory or queue leaks under sustained load | Latency degrades over the course of the run, not at start |
| Cascading timeouts | response_loop flips for some conversations as agent retries fragment |
| Routing engine bottlenecks | Tail latency (p95, p99) diverges from p50 |
The Setup
Two knobs control load:
- Max Parallel Requests on the voice target: caps concurrent calls hitting your agent.
- Total volume = scenario rows x repeats.
In the App
- Set concurrency on the target. Go to Targets, create or edit your voice target, and set Max Parallel Requests to the desired concurrency (e.g. 10, 20, 50). Leave it empty for unlimited concurrency.
- Build the scenario. Create a scenario with representative test cases. More rows means more diversity across concurrent calls.
- Configure repeats. In the simulation form under Advanced Settings, set Repeats to multiply the total call volume. For example, 5 scenario rows with 2 repeats produces 10 total calls.
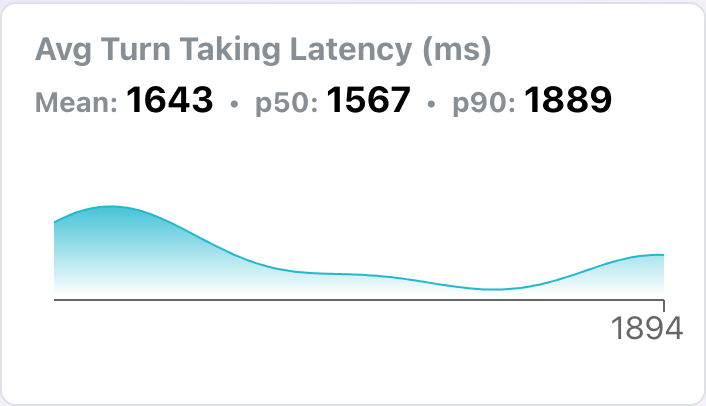
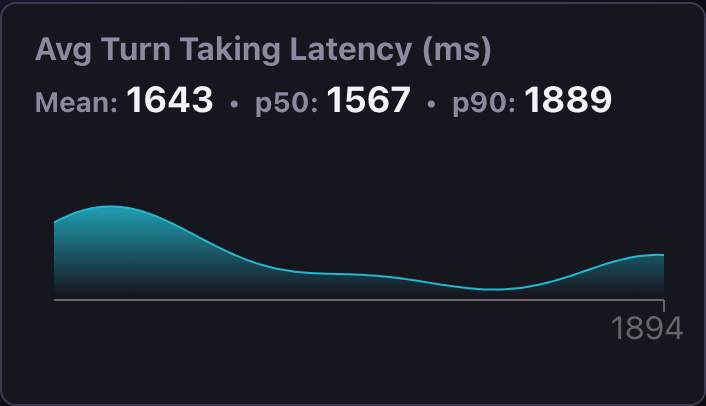
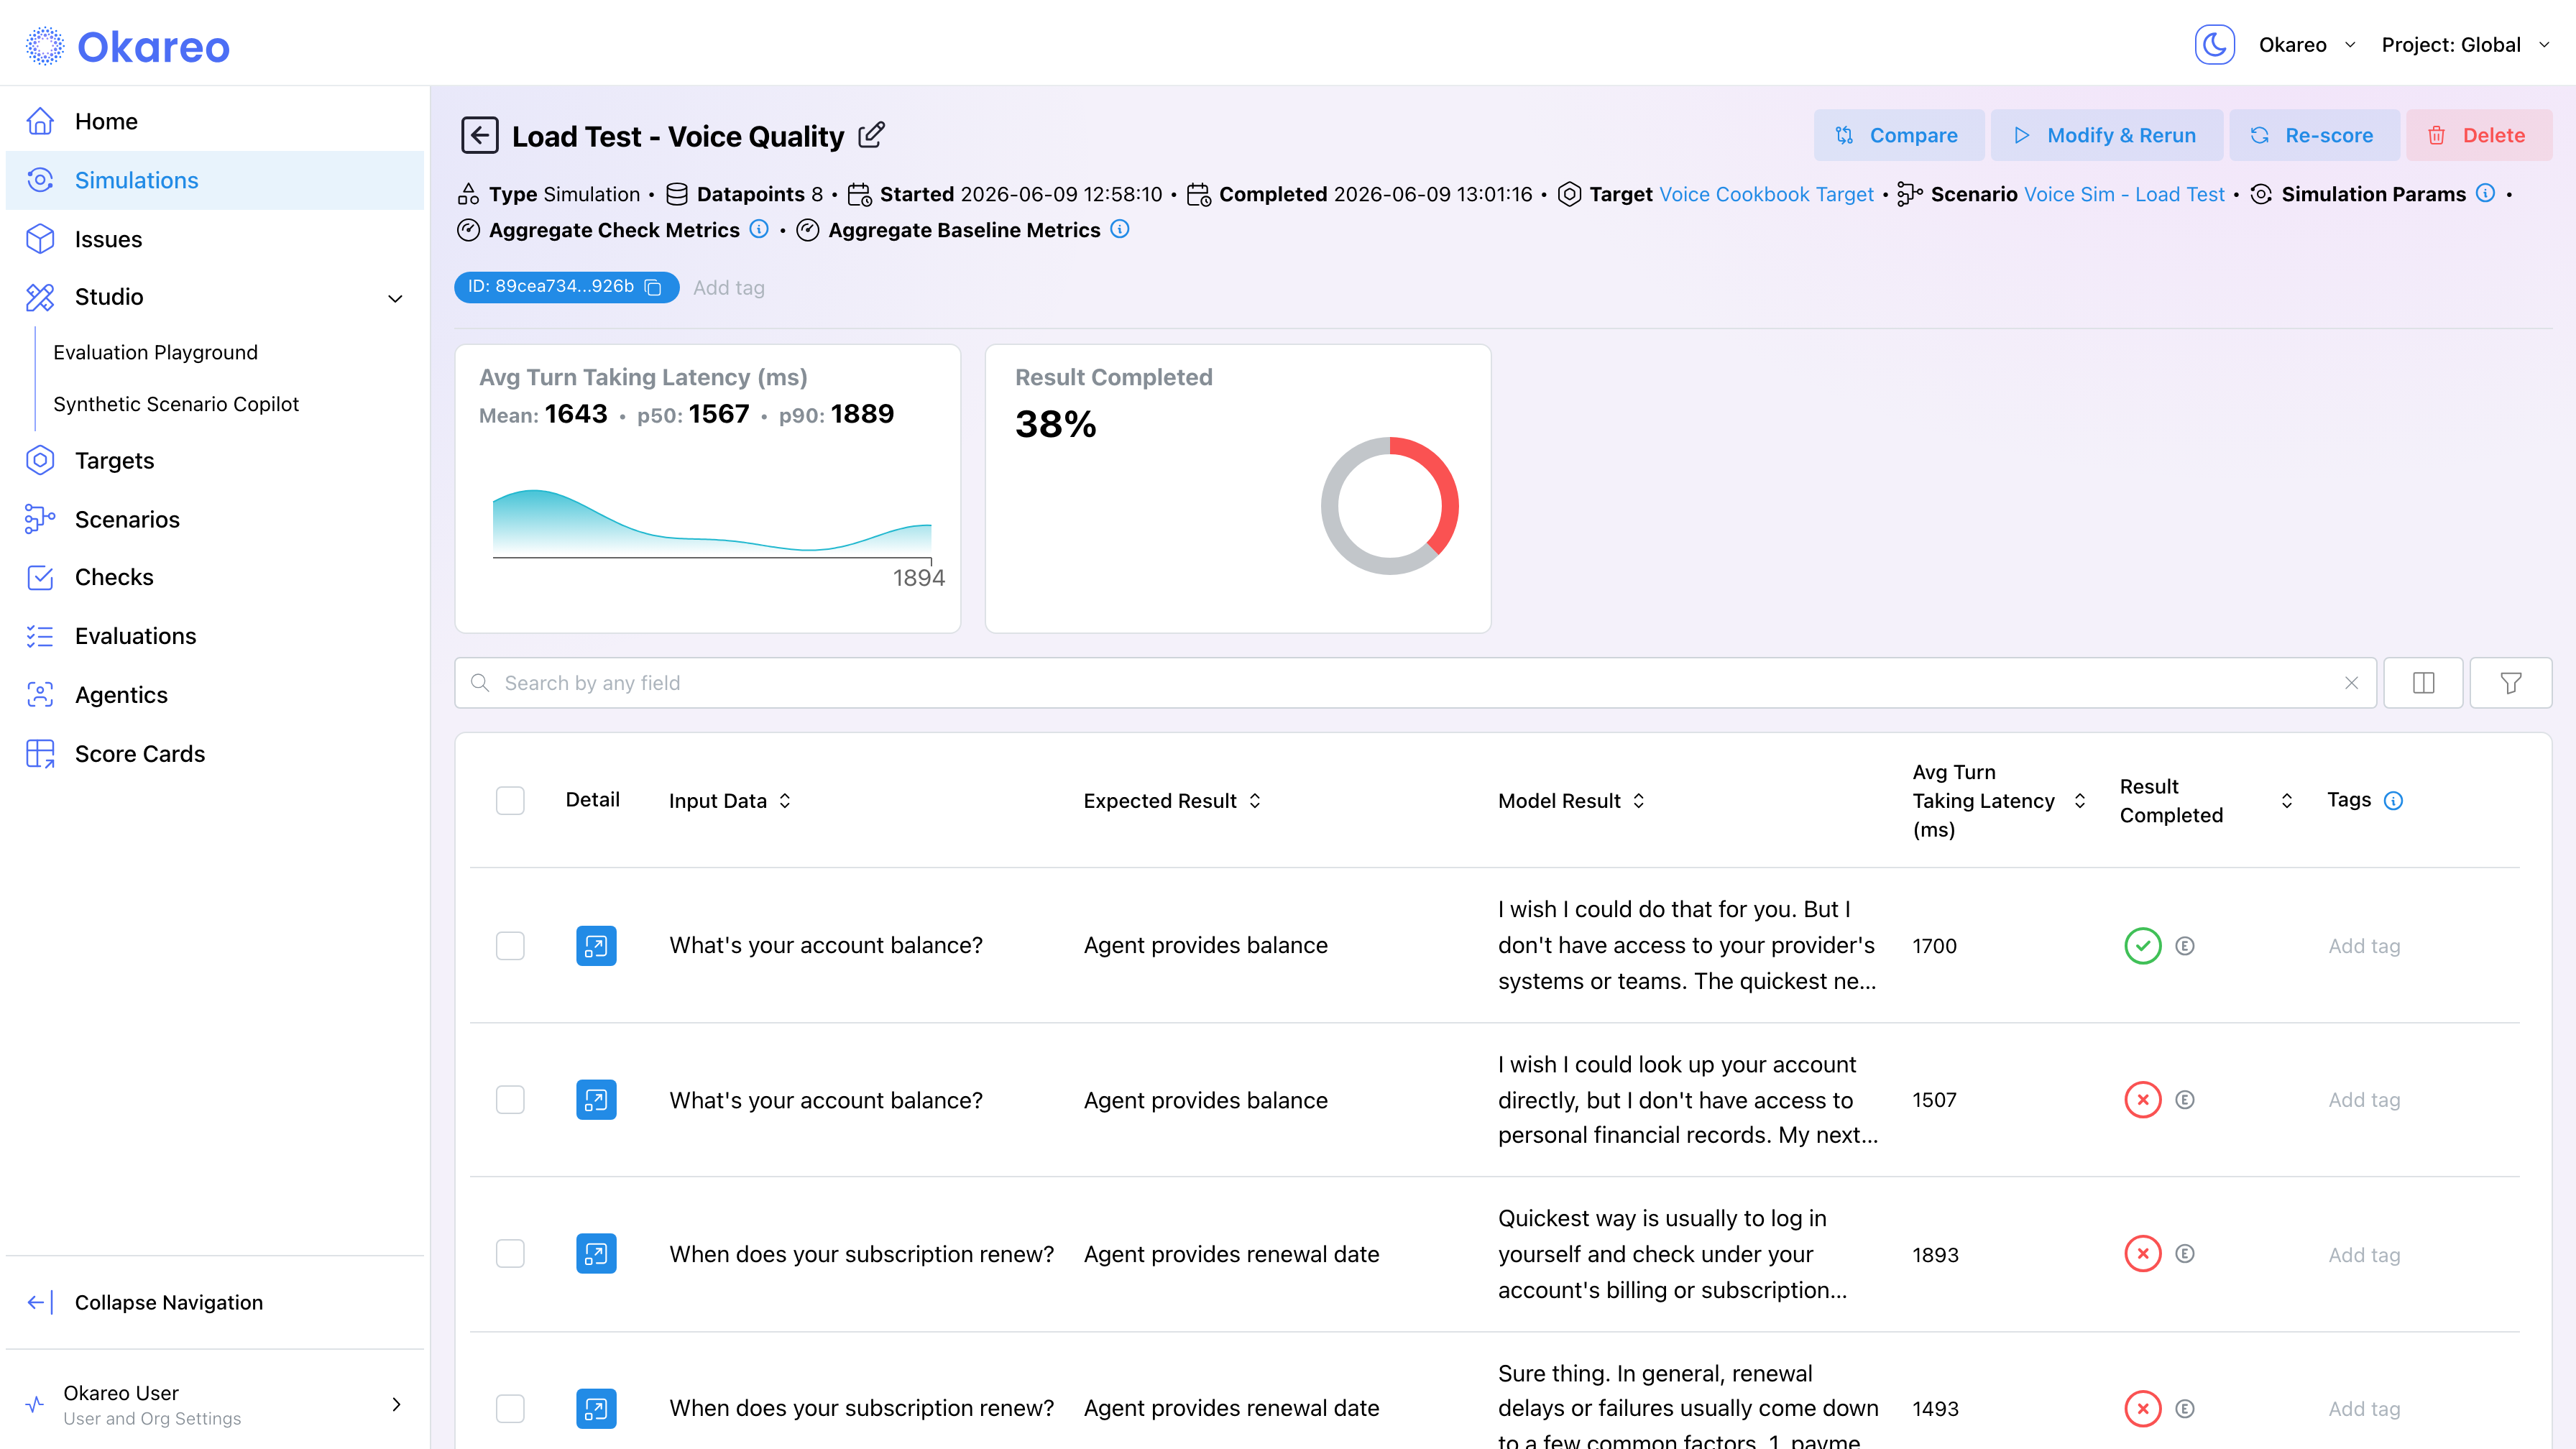
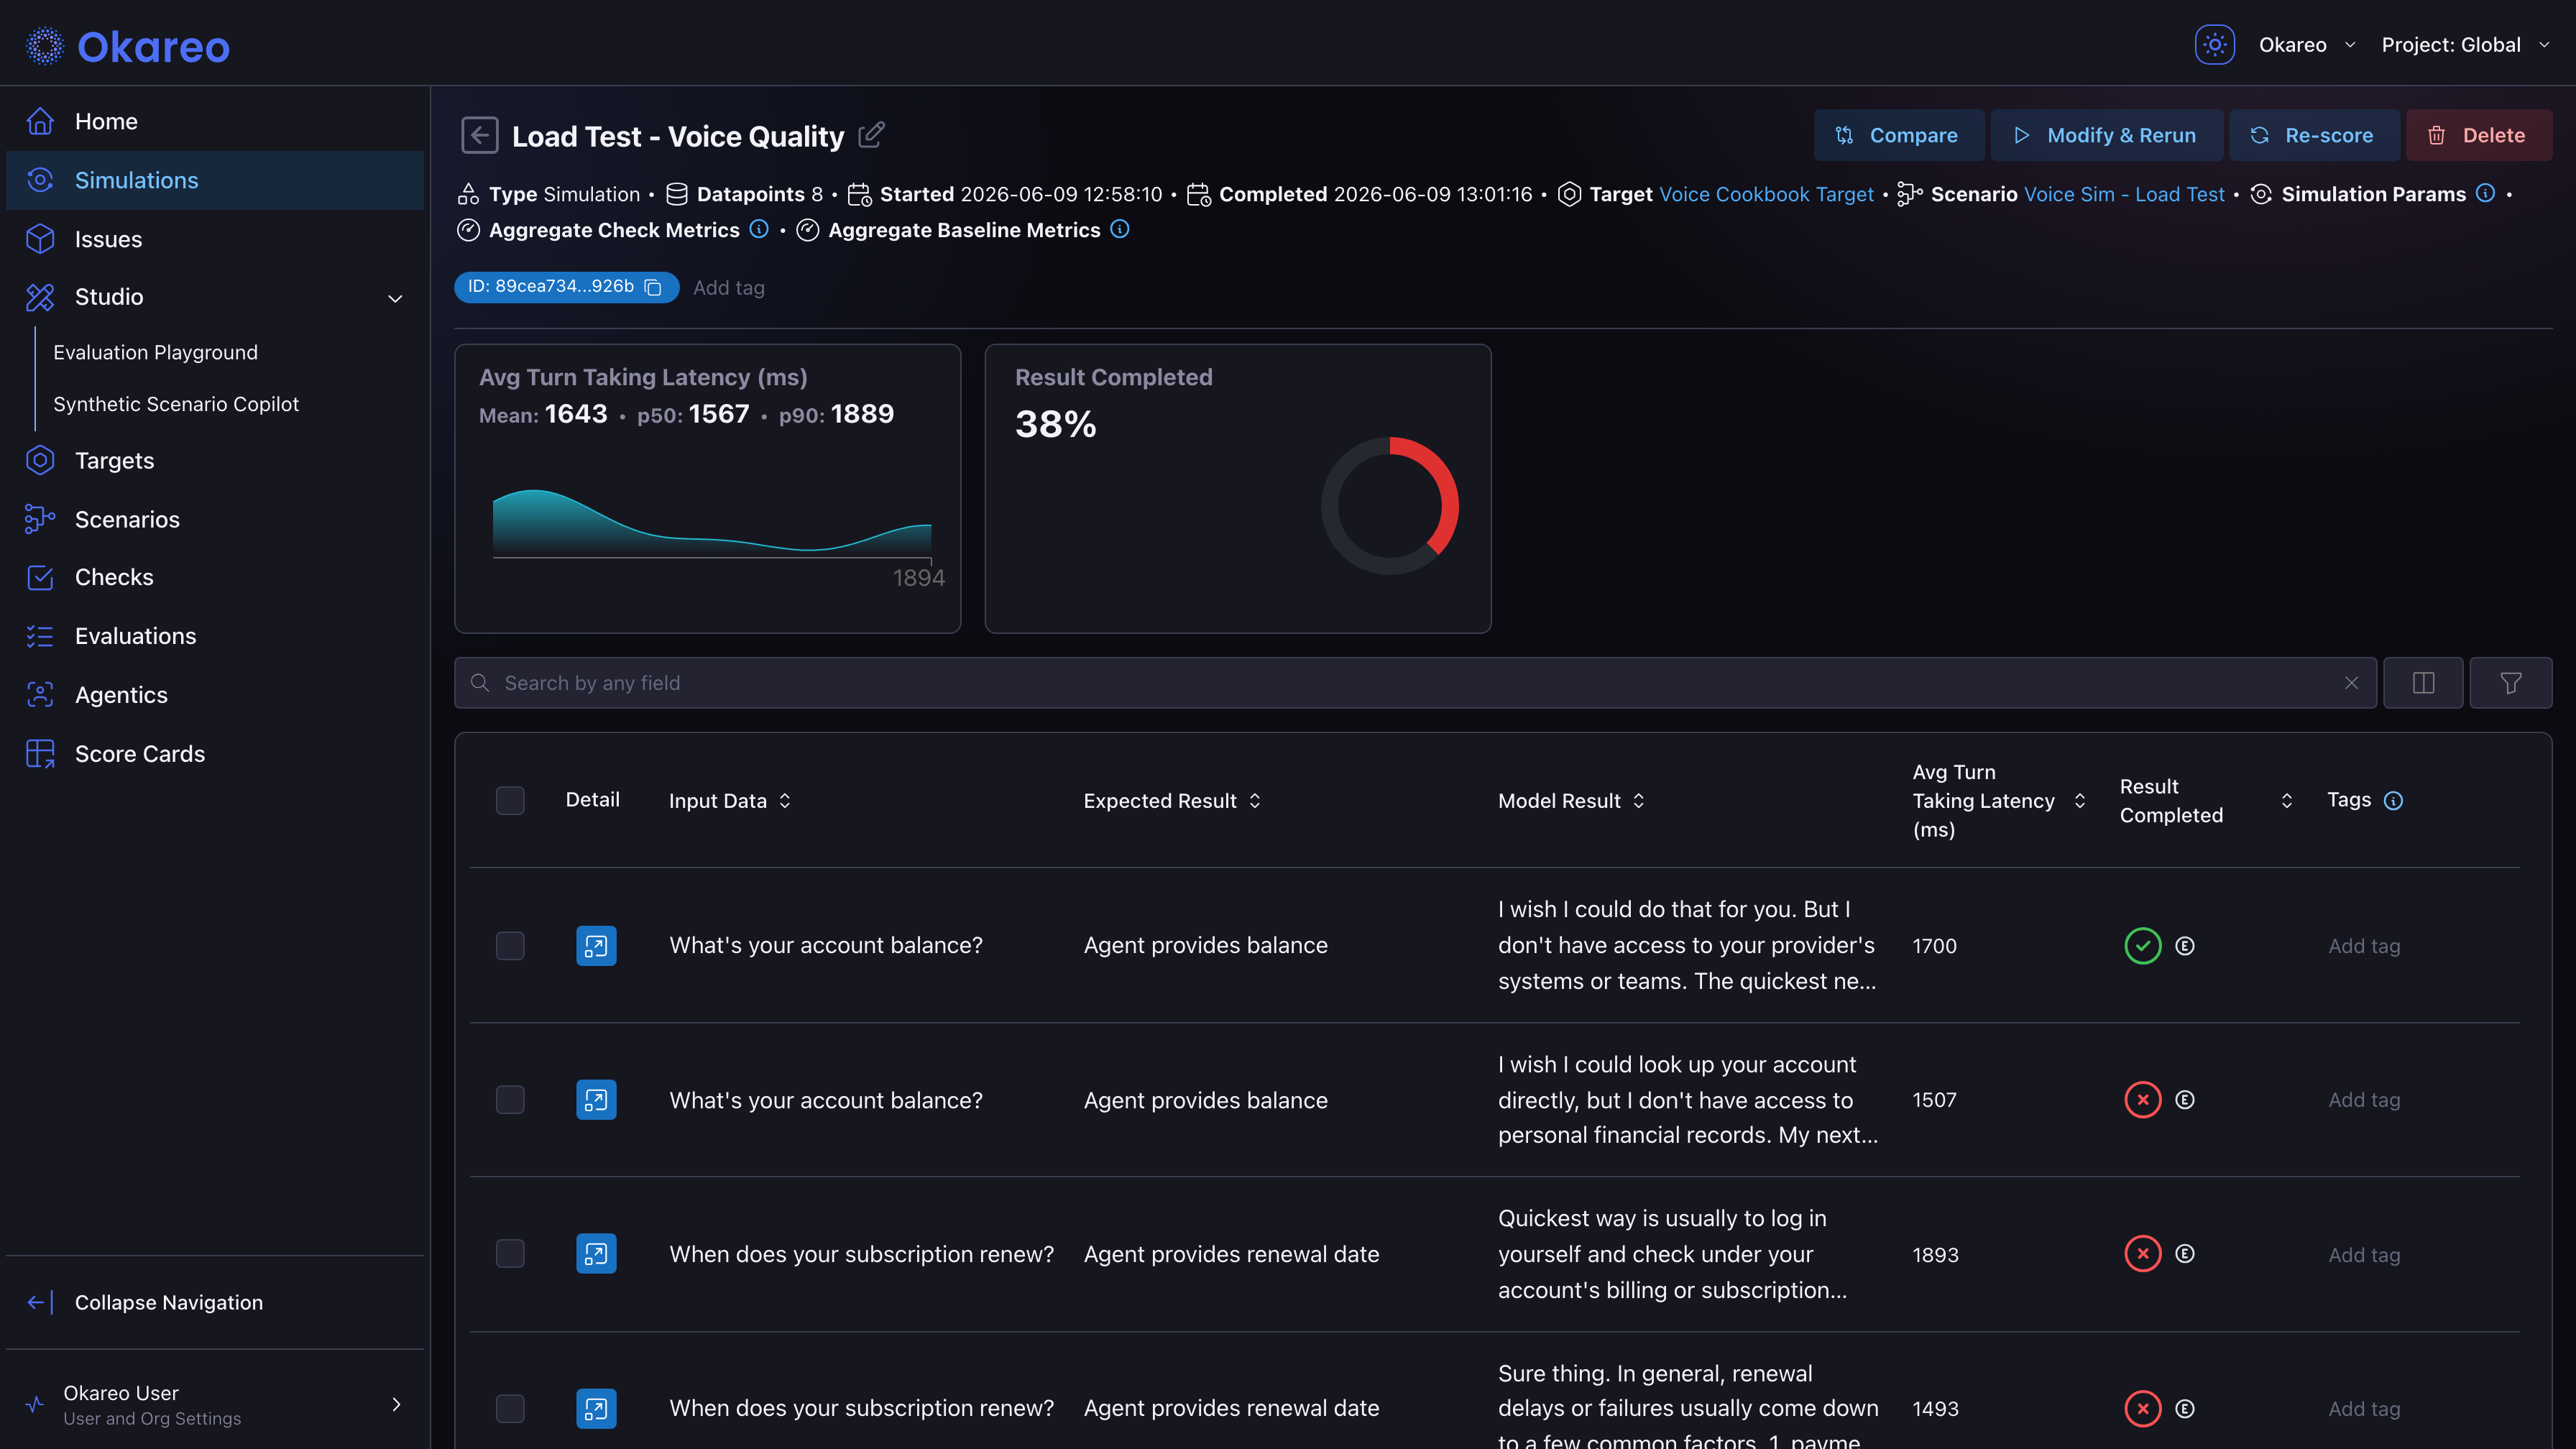
- Run and inspect. After the run completes, open the results to see mean / p50 / p90 latency with distribution charts, and pass rates for each check.
From the SDK
The same setup is available programmatically:
import os
from okareo import Okareo
from okareo.model_under_test import PhoneTarget, Target
from okareo_api_client.models import ScenarioSetCreate

okareo = Okareo(os.environ["OKAREO_API_KEY"])

driver = okareo.generate_driver_prompt("Customer calling support with a routine account question")

scenario = okareo.create_scenario_set(ScenarioSetCreate(
    name="Voice Load Test",
    seed_data=okareo.seed_data_from_list([
        {"input": "What's your account balance?",            "result": "Agent provides balance"},
        {"input": "When does your subscription renew?",      "result": "Agent provides renewal date"},
        {"input": "Get a copy of your last invoice.",        "result": "Agent sends invoice"},
        {"input": "Is there a fee to upgrade your plan?",    "result": "Agent explains upgrade costs"},
        {"input": "How do I add a second user?",             "result": "Agent explains multi-user setup"},
    ]),
))

result = okareo.run_simulation(
    name="Load Test - Voice Quality",
    target=Target(
        name="My Voice Agent",
        target=PhoneTarget(phone_number="+1XXXXXXXXXX", max_parallel_requests=10),
    ),
    scenario=scenario,
    driver=driver,
    max_turns=3,
    repeats=2,  # 5 scenarios x 2 repeats = 10 concurrent calls
    checks=["avg_turn_taking_latency", "result_completed"],
)
Default plans cap concurrency at a low level for safety. Okareo scales to hundreds or thousands of concurrent calls. Reach out to configure higher concurrency for your plan.
Reading Percentile Scores
Latency-style checks (avg_turn_taking_latency, avg_words_per_minute) get server-computed percentile scores in addition to means.
In the App
The run detail page shows mean, p50, and p90 values on latency score cards, with a distribution chart of per-conversation values. The per-conversation table below lists each call's latency; sort by the check column to identify which conversations had the worst latency, and click Detail to inspect them.
From the SDK
metrics = result.model_metrics.to_dict()
scores = metrics["mean_scores"]
percentiles = metrics.get("percentile_scores", {})

latency_pct = percentiles.get("avg_turn_taking_latency", {})

print(f"  Mean latency: {scores.get('avg_turn_taking_latency')} ms")
print(f"  p50:          {latency_pct.get('p50')} ms")
print(f"  p90:          {latency_pct.get('p90')} ms")
| Aggregation level | What it represents |
|---|---|
| Per-turn raw sample | Each turn's latency between caller-stops and agent-replies |
Per-conversation avg_turn_taking_latency | Average across the call's turns (in scores_by_row) |
| Run-level p50 / p90 | Percentile across the run's per-conversation averages |
This is why p50/p90 from a load run is meaningful: it tells you what fraction of conversations (not turns) had degraded latency, which is the user-visible failure unit.
For the full set of checks that get percentile aggregation, see Voice Checks.
Interpreting Results
Run a baseline at low concurrency first. Then run progressively higher loads and watch:
| Pattern | Meaning |
|---|---|
| Mean and p50 stable, p90 climbs | Tail-latency issue. A subset of calls is hitting a slow path. |
| Mean climbs proportionally to concurrency | Backend saturation. Compute or queue depth is the bottleneck. |
result_completed drops at high concurrency | Conversations are failing partway through, not just slowing. |
Pattern cleaner at low max_parallel_requests | Your agent has a per-second limit lower than you thought. |
Where to Go Next
- Experimentation and A/B Testing: compare load runs against each other (e.g. before vs after an infra change).
- Voice Augmentation: combine concurrency with realistic noise and barge-in for worst-case conditions.
- Scheduling Simulations: run nightly load tests on cron.
Full runnable script: 08_load_test.py