Experimentation and A/B Testing
Every change to an AI agent carries risk. A new system prompt, a different LLM, an updated ASR model, a revised tool schema. Any of these can improve some conversations while degrading others. Without controlled experimentation, shipping a change is a bet. Okareo provides the statistical framework to turn that bet into an evidence-based decision.
Why Experiment on AI Agents
Product teams have long used A/B testing to measure the impact of UI changes on user behavior. AI agents need the same rigor, but the variables are different: prompts, models, voice providers, tool definitions, and conversation logic. The question is the same. Did this change actually make things better, or is the movement just noise?
Okareo's Compare Evaluations answers that question with both frequentist and Bayesian statistical testing, purpose-built for AI agent evaluation. Run the same scenarios against two configurations, and get a rigorous statistical comparison across every check.
What You Can Test
Any change to your agent stack is a candidate for experimentation:
| Variable | Example |
|---|---|
| LLM | Swap GPT-4o for Claude Sonnet and measure task completion, latency, and compliance |
| System prompt | Rewrite agent instructions and compare response quality and guardrail adherence |
| ASR provider or model | Switch speech recognition and measure whether downstream task accuracy holds |
| TTS voice or provider | Change the voice and evaluate conversation flow and caller experience metrics |
| Tool definitions | Update function schemas and verify the agent still calls the right tools at the right time |
| Augmentation conditions | Add background noise or barge-in to test whether a change holds up under stress |
| Driver persona | Introduce adversarial or edge-case callers to probe robustness |
How It Works
1. Run two evaluations against the same scenario
Change only the variable you are testing. Keep the Driver, Scenario, Checks, and repeats identical so the comparison is fair.
2. Open Compare Evaluations
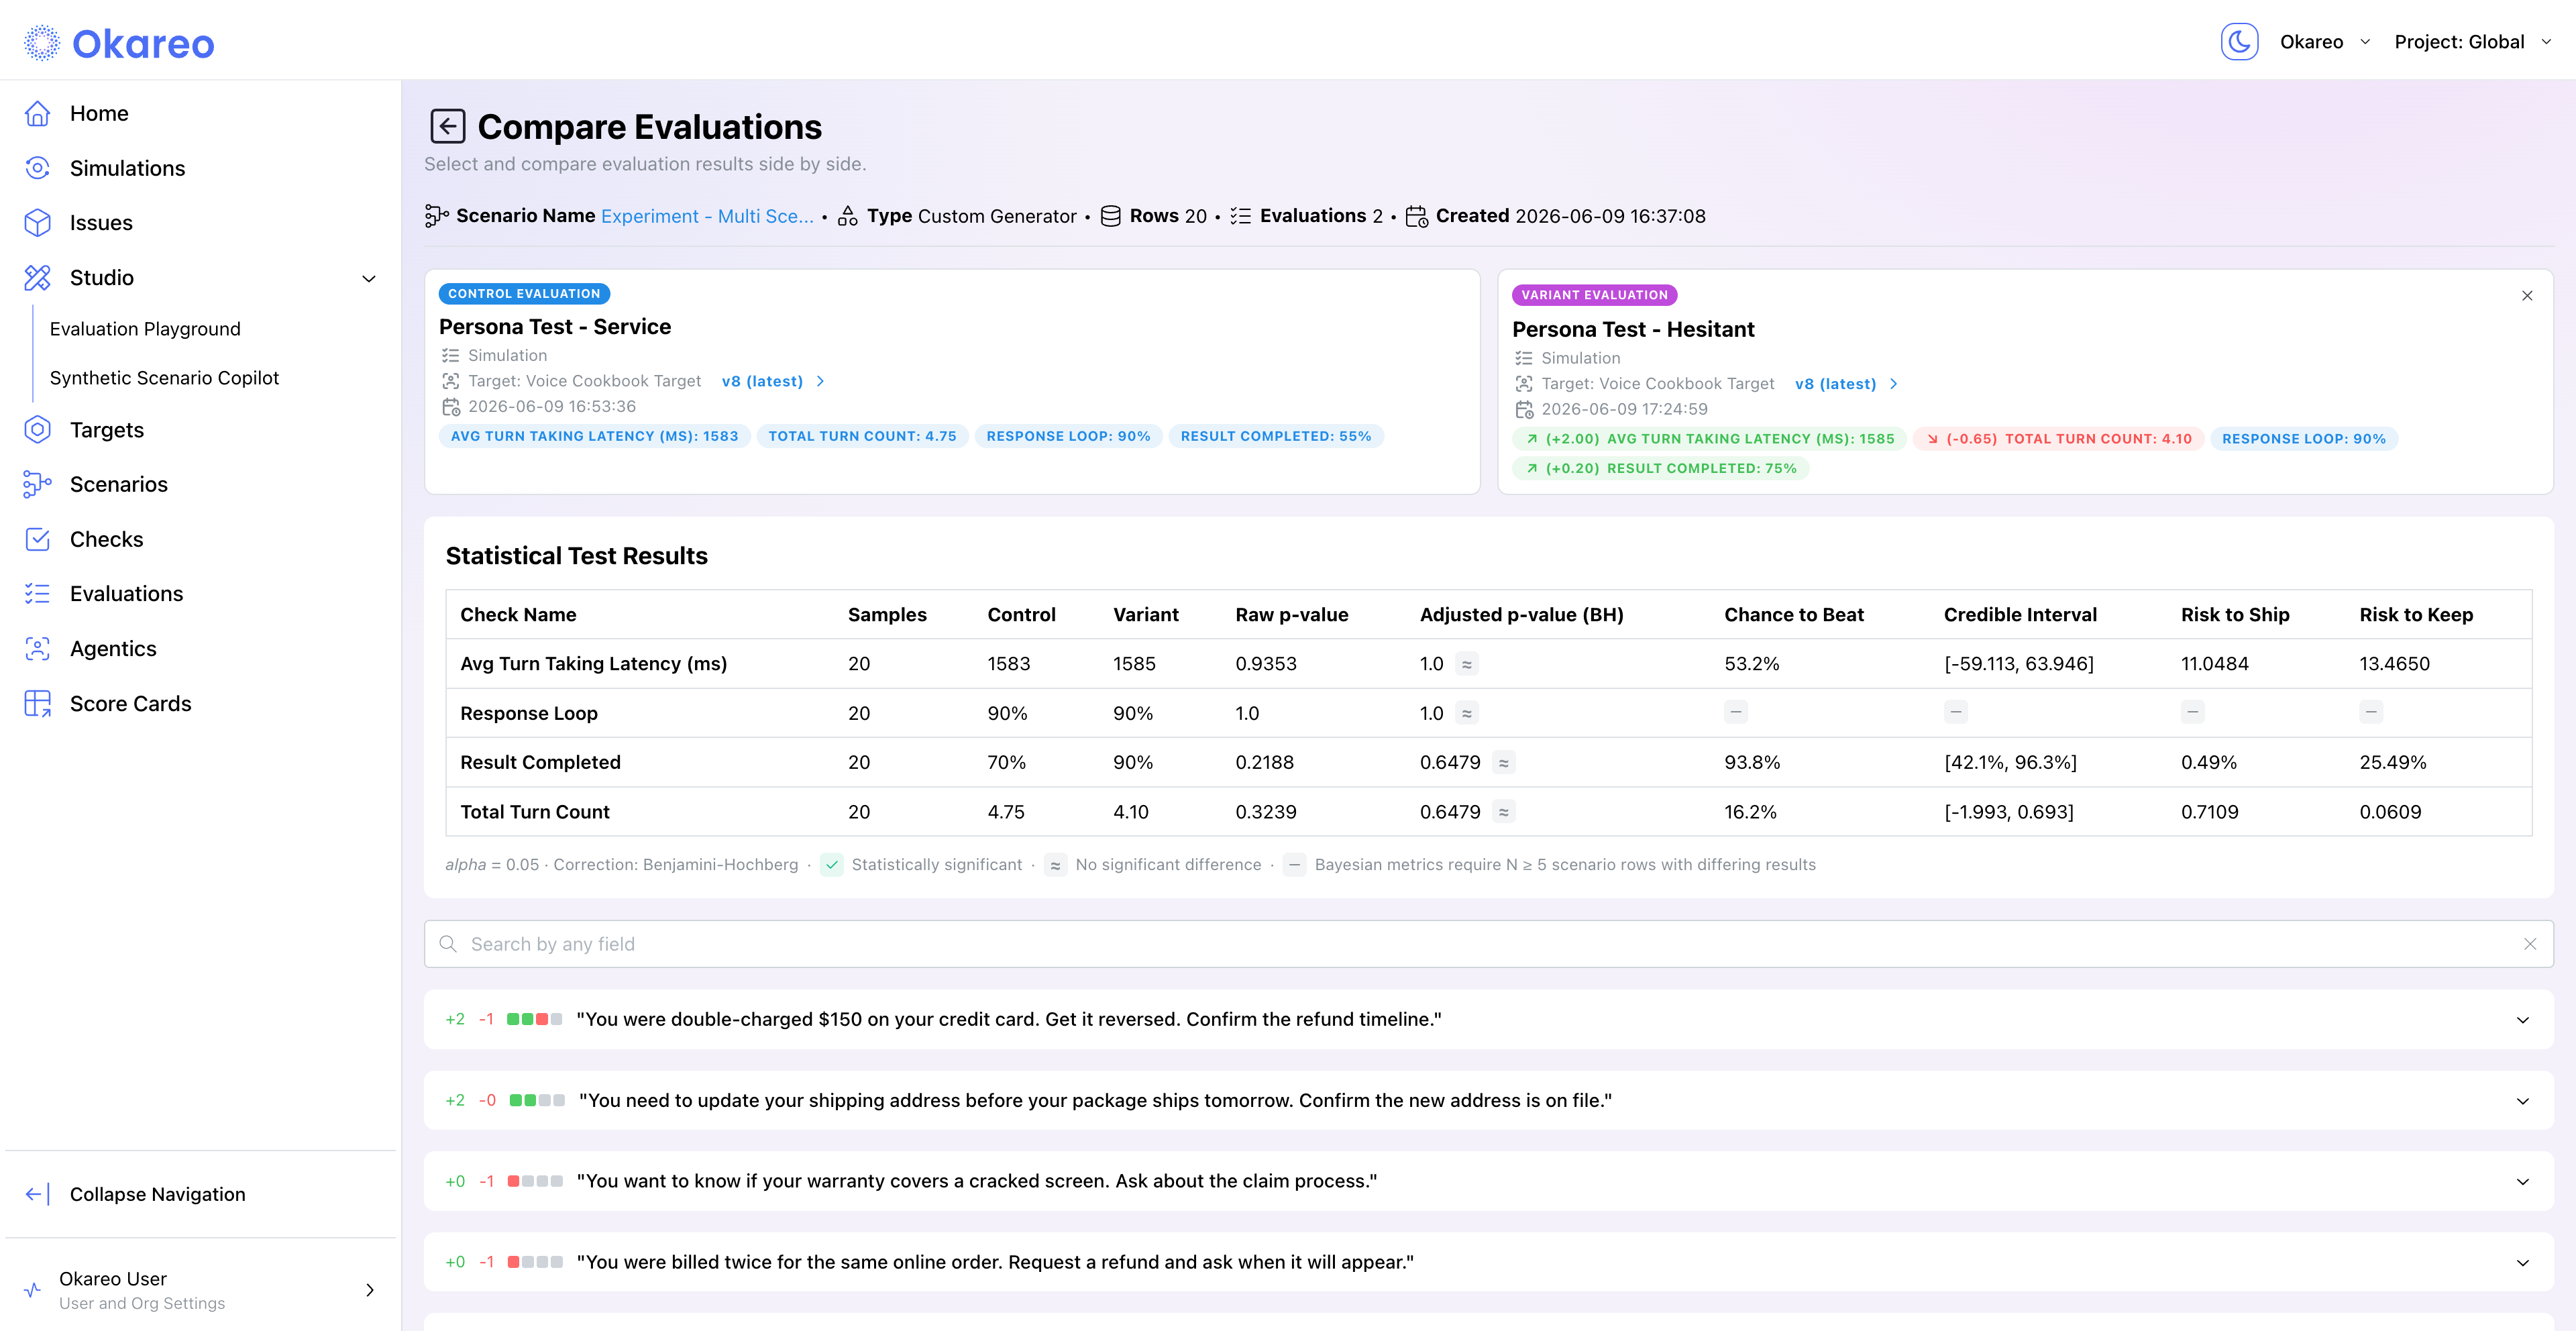
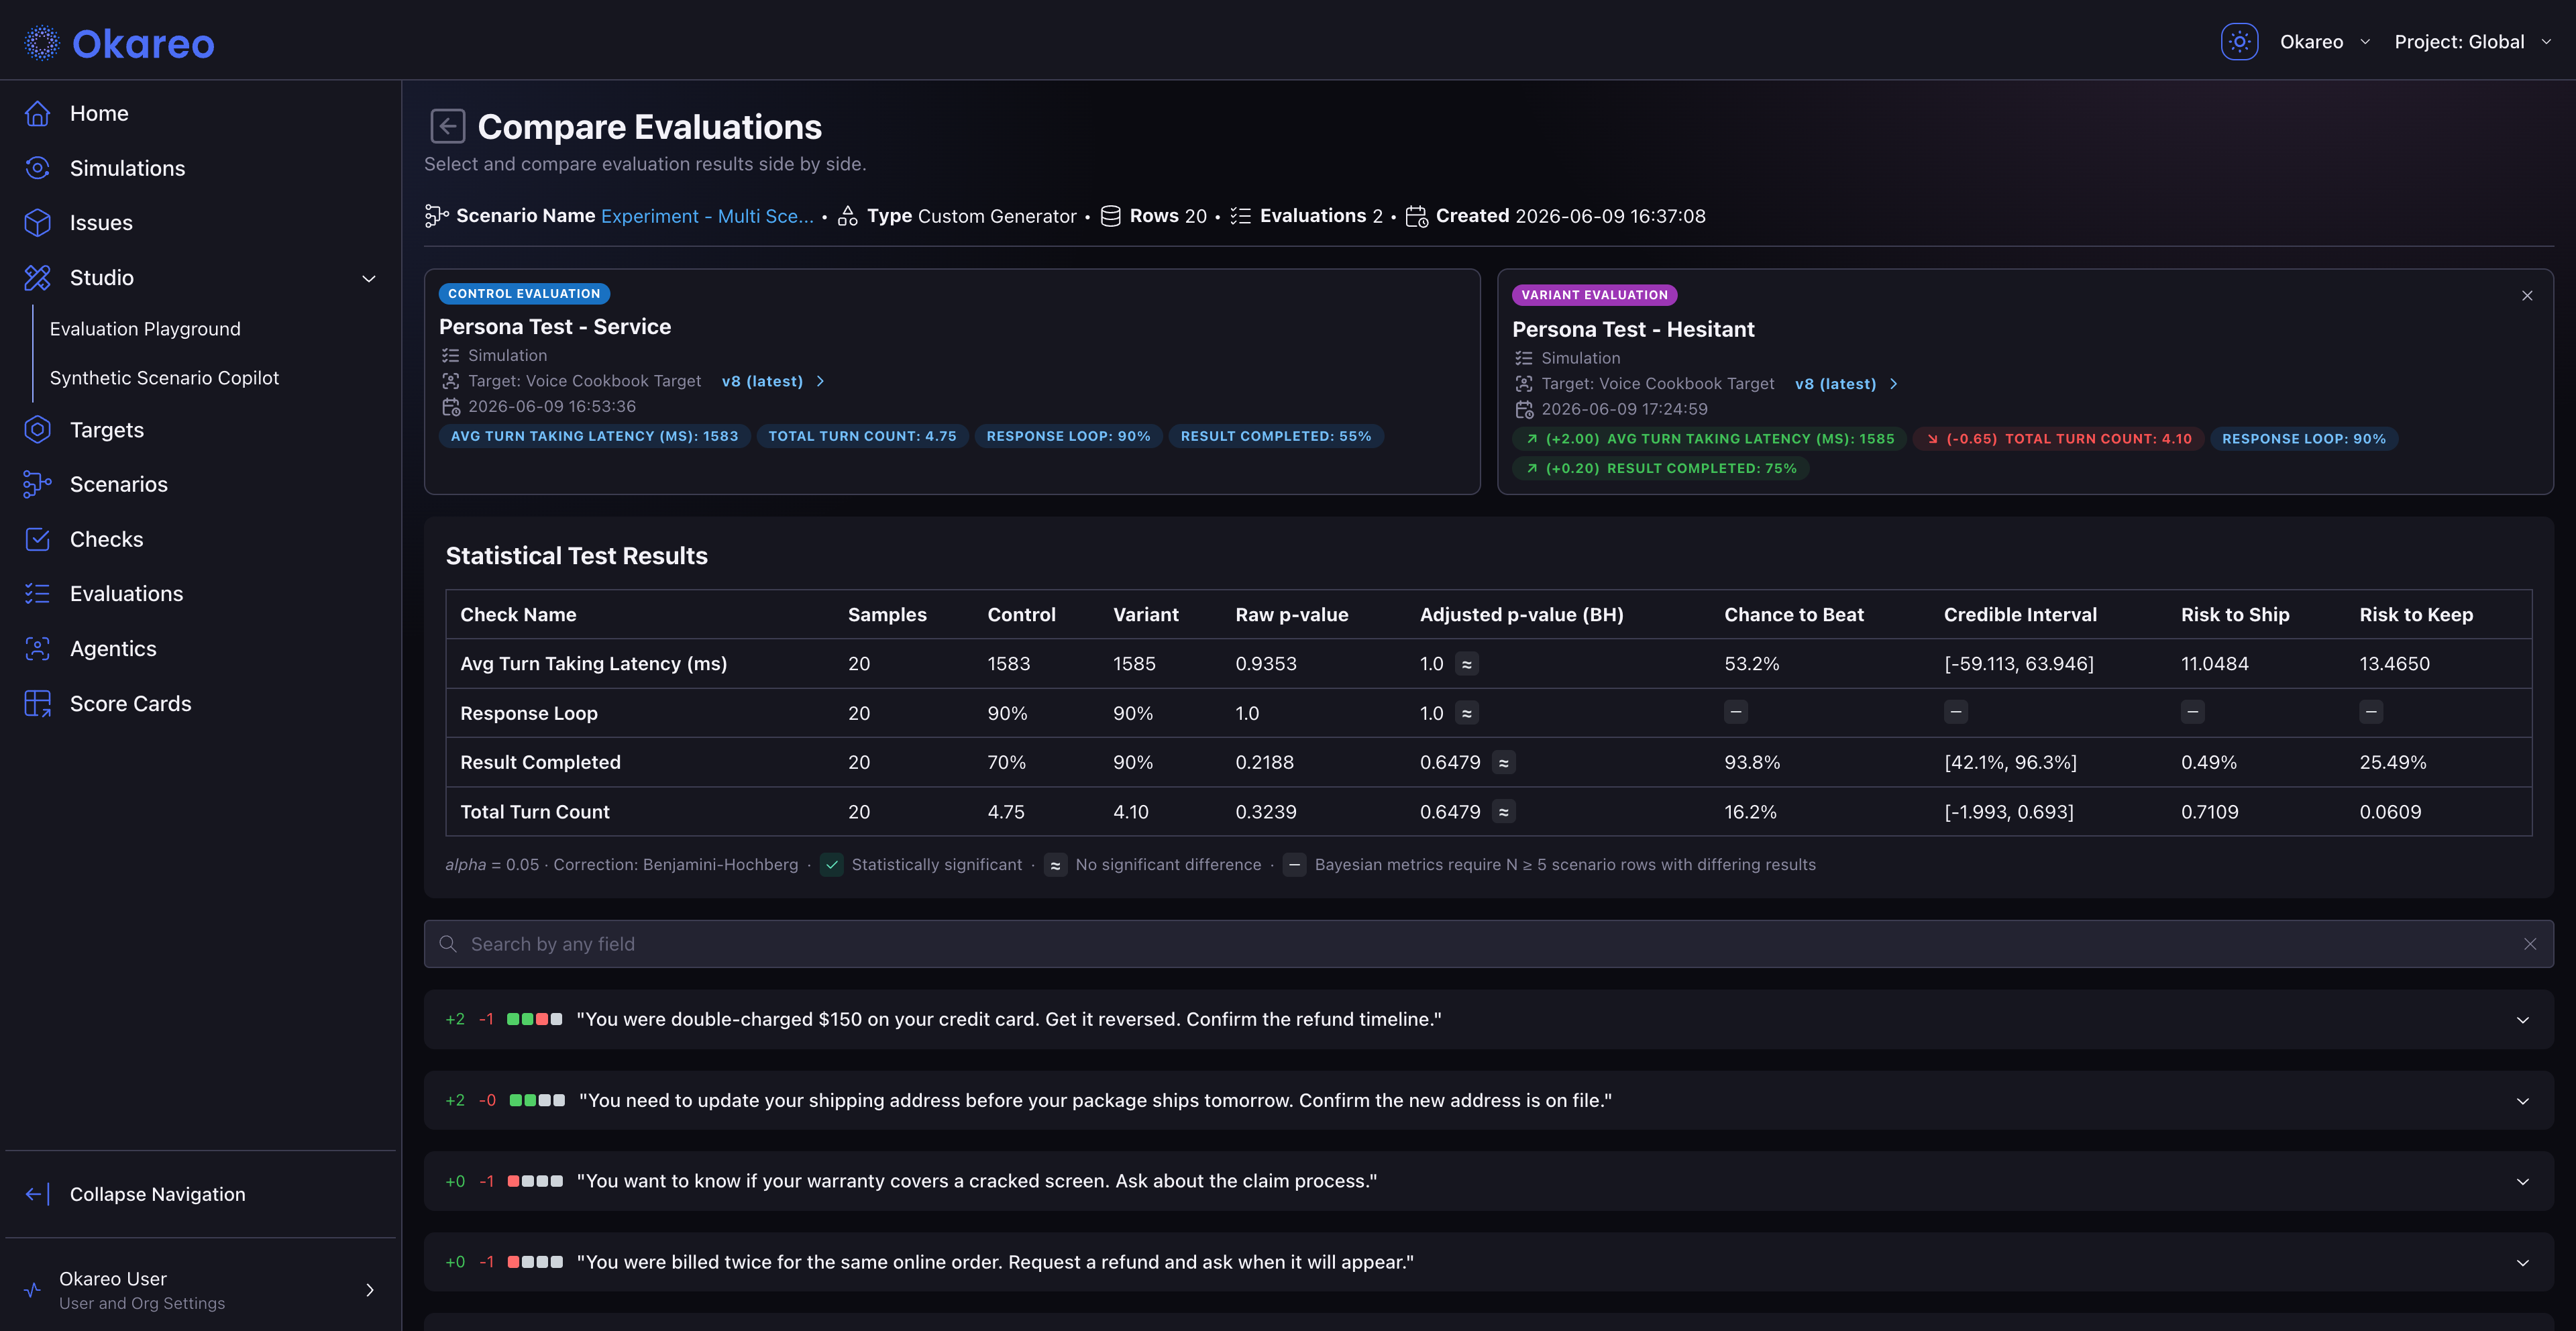
In the app: Click Compare on any finished run's detail page (or Compare Evaluations on a scenario card). Two cards appear side by side: click each to select the Control evaluation (your baseline) and the Variant (the candidate). The variant list is automatically scoped to finished runs of the same type on the same scenario, so comparisons stay apples-to-apples.
From the SDK: Run two simulations programmatically, then open either in the app and click Compare.
3. Review the statistical results
Okareo computes paired statistical tests across every check that both evaluations have in common:
| Column | What it tells you |
|---|---|
| Samples | Number of matched scenario rows |
| Control | Check score (pass rate or mean) for the baseline evaluation |
| Variant | Check score for the candidate evaluation |
| Raw p-value | McNemar exact (binary checks) or paired t-test (score checks) |
| Adjusted p-value (BH) | Benjamini-Hochberg correction for multiple comparisons |
| Chance to Beat | Bayesian posterior probability that the variant outperforms the control |
| Credible Interval | 95% credible interval for the difference between variant and control |
| Risk to Ship | Expected loss if you ship the variant and it is actually worse |
| Risk to Keep | Expected loss if you keep the control and the variant is actually better |
A check icon marks statistically significant differences (at alpha = 0.05). An approximately-equal icon marks differences that are not significant. Bayesian metrics (Chance to Beat, Credible Interval, Risk to Ship/Keep) require at least 5 scenario rows with differing results.
Reading the Results
Focus on three columns for a ship/no-ship decision:
- Adjusted p-value (BH). Is the difference statistically significant after correcting for the number of checks being compared?
- Chance to Beat. What is the probability that the variant is genuinely better than the control?
- Risk to Ship vs. Risk to Keep. What is the expected downside of each decision?
If Chance to Beat is high (above 80%) and Risk to Ship is low, you have strong evidence to ship. If Risk to Keep is high, staying on the current configuration is costing you real quality.
These Bayesian metrics are designed to be interpretable without a statistics background. Chance to Beat is a direct probability ("there is a 92% chance the new prompt is better"). Risk to Ship and Risk to Keep quantify the stakes in the units of the check itself.
Designing Experiments
For a comparison to be meaningful, hold everything constant except the variable you are testing.
| Variable being tested | Hold constant | Vary |
|---|---|---|
| Agent prompt change | Driver, Scenario, Checks, repeats | Target (or its underlying agent config) |
| Model swap | Driver, Scenario, Checks, repeats | Target (pointing at the new model) |
| Augmentation impact | Driver, Target, Scenario, Checks, repeats | augmentation parameter on run_simulation |
| Driver behavior change | Target, Scenario, Checks, repeats | Driver |
| Statistical power | Driver, Target, Scenario, Checks | repeats (raise to 5 or 10 for noisy checks) |
Total simulations = scenario rows x repeats. See Running Simulations for the full formula.
Sample Size and Statistical Power
A single conversation is an anecdote. Comparing two evaluations at repeats=1 will show movement that is often just noise. Raise repeats until the between-evaluation signal is larger than the within-evaluation variance.
| Goal | Suggested setup |
|---|---|
| Quick sanity check | 2 to 4 scenarios, repeats=1 (about 4 calls). Catches catastrophic regressions only. |
| Pre-deploy validation | 5 to 10 scenarios, repeats=2 (about 10 to 20 calls). Reasonable signal for binary checks. |
| Nightly regression suite | 8 to 15 scenarios, repeats=3 (about 24 to 45 calls). Good signal for noisy LLM checks like response_consistency. |
| High-confidence launch decision | 15+ scenarios, repeats=5 (about 75+ calls). For changes you cannot easily roll back. |
Re-scoring (instead of re-running) is the right tool when you only want to compare check definitions on the same conversations. See Re-Scoring Past Runs.
Where to Go Next
- CI Gating: automate threshold-based quality gates in your CI pipeline.
- Load Testing: stress-test under concurrency after validating quality.
- Re-Scoring Past Runs: compare check definitions without re-running conversations.
- Scheduling Simulations: wire experiments into nightly or per-push automation.